 Home > Bio-Separation > ChromSpeed™ S101 & S103
 - Bio-Separation
- Sepax Biological
- Sepax Process Media
- Mitsubishi Chemical
- Resindion

MabSpeed™ rP102 and rP111
MabSpeed™ rP102 and rP111 are high-throughput Protein A chromatography media that have been designed for the production of therapeutic monoclonal antibodies (mAbs). The hydrophilic, high-flow tolerant methacrylate media is optimized for both high capacity and maximum throughput. The durable matrix withstands a high flow rate of up to 1,000 cm/h, and the oriented coupling of the rProtein-A ligand delivers a product pool that is high in purity and yield. The rProtein-A ligand is expressed in E. coli and is free of components of mammalian origin. The products are manufactured in Japan with state-of-the-art technology as shown in Figure 1.
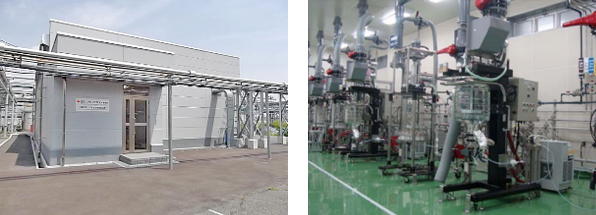
Figure 1. MabSpeed™ series are manufactured in Fukuoka, Japan ,with state-of-the-art technology.
Highlights of screening columns
- Spherical and mono-disperse particles brings you:
- Easy and reproducible packing
- Low pressure drop
- Non-compressive bed
- Rigid and durable matrix allows you to have:
- Unnecessary swelling like agarose
- Longer media life
- Wide pH and solvent compatibility
- Fast kinetics, i.e. fact adsorption and desorption, leads to shorter operation time.
- High mechanical resistance of up to 1,000 cm/h, even at production scale, results in high productivities compared with the traditional agarose media.
MabSpeed™ series
The MabSpeed™ family of media for process-scale purification of monoclonal antibodies comprises MabSpeed™ rP102, rP111, and rP202. Both MabSpeed™ rP102 and rP111 uses wild type of recombinant Protein-A ligand and is designed for high-throughput purification of monoclonal antibodies from large volumes of feed. MabSpeed™ rP102 and rP111 are different by their particle size, and MabSpeed™ rP111 demonstrates even higher dynamic binding capacity (DBC), optimized with smaller particle size of 35 μm. MabSpeed™ rP202 is a product with engineered Protein-A ligand with superior DBC. For more information on MabSpeed™ rP202, please refer to Data Sheet No. 03-07-C-0201. Screening columns of MabSpeed™ series are also available in 1 mL and 5 mL sizes. Fore more information, please refer to Data Sheet No. 03-01-C-0101.
Physical and chemical characteristics
| Grade Name | MabSpeed™ rP102 | MabSpeed™ rP111 |
|---|---|---|
| Ligand | rProtein-A (wild type) | |
| Ligand coupling method | Chemically immobilized with epoxy linkage | |
| Matrix | Rigid, highly cross-linked methacrylate | |
| Average particle size | 45μm | 35μm |
| Pore size* | ≥ ~1000A | |
| Dynamic binding capacity** | 18-24 g/L-media | > 35 g/L-media |
| Chemical stability | Stable in all aqueous buffers commonly used in protein A chromatography, including 20% ethanol and 2% benzyl alcohol | |
| pH working range | 1 to 12 | |
| Cleaning-in-place stability | 0.1N NaOH | |
| Temperature stability*** | 2℃ to 40℃ | |
| Max. mobile phase velocity | ≤ 1,000 cm/h | |
| Delivery conditions | 20% ethanol | |
**DBCs are measured with a human polyclonal IgG with a bed height of 12.7 cm, a flow rate of 400 cm/h (MabSpeed™ rP102)
and of 200 cm/h (MabSpeed™ rP111) at a 10% break-through point.
***Recommended long term storage conditions: +2℃ to +8℃, 20% ethanol.
Hydraulic data shows low pressure drops
The spherical and mono-dispersed particles in nature offers easy packing for MabSpeed™. The hydraulic data is important in aspect of the packing as well. Figure 2 represents the hydraulic data for MabSpeed™ rP102 and rP111 among competing products available on market. As shown, both MabSpeed™ products has a linear correlation with the linear velocity as theoretically predicted, while other products have exponential increase.
Figure 3. Breakthrough curves with various flow rates in cm/h. Experimental conditions: a column of 5mm ID x 200 mm, a sample of 1.0mg/mL of human γ-globulin, and buffer of PBS pH 7.4 with a temperature of 20℃.
Figure 4. Buffer exchange profile at three flow rates listed in cm/h. The solid line represents MabSpeed™ rP111, and the dotted line represents agarose media. Experimental conditions: a column of 10 mm ID x 200 mm, base of 0.8M NaCl, load with 0.05M NaCl, with a temperature of 20℃. Time to equilibration was measured by ~6.0 mS/cm.
The shorter operation time is expected with MabSpeed™. A preliminary productivity simulation shown in Table 1. As seen on the table, MabSpeed™ rP111 for instance offers about 10% improvement on IgG production per day when processed with and 200 cm/h, and about 30% more productivity at 400 cm/h. MabSpeed™ additionally has advantages to run even faster flow rate of 600 cm/h, which would bring even higher productivity, hence high throughput overall.
Table 1. Preliminary productivity simulation comparing MabSpeed™ rP111 and agarose media.
| MabSpeed™ rP111 | Agarose media | |||||
|---|---|---|---|---|---|---|
| 200cm/h | 400cm/h | 600cm/h | 200cm/h | 400cm/h | ||
| Starting Material | adsorption | 206 | 89 | 56 | 200 | 62 |
| misc. | 81 | 48 | 37 | 105 | 60 | |
| cycle/day | 5 | 10.5 | 15.4 | 4.7 | 11.8 | |
| DBC (1% BTC) | 34.4 | 29.8 | 28.2 | 33.3 | 20.6 | |
| Column volume (L) | 1.57 | |||||
| IgG production (g/day) | 270 | 489 | 681 | 247 | 382 | |
Low HCP contamination and Protein-A ligand leakage with high recovery with CHO cell culture purification
CHO cell culture purification is represented in Figure 5 with MabSpeed™ rP111. The data indicates sharp elution just like other media seen on market. Analysis of HCP contaminants, Protein-A ligand leakage, and the recovery was measured as listed in Table 2, indicating that the MabSpeed™ rP111 offers superior alternative for such purifications.
Figure 5. CHO cell culture (0.1 mg/mL mAb, 100 mL) purification with conditions of: a column (MabSpeed™ rP111, 5mm ID x 20 cm), binding buffer (PBS), wash buffer (PBS), elution buffer (0.1M citrate pH 3.0), flow rate (400 cm/h), with a system AKTA avant. Table 2. HCP contaminants, Protein-A ligand leakage, and recovery analysis at each purification step of CHO cell culture, conducted at Figure 5.
| Starting material | 116,160 ppm (ng-HCP/mg-IgG)(HCP: 11,616 ng/mL IgG: 0.1mg/mL) | |
|---|---|---|
| IgG fraction | MabSpeed™ rP111 | 9.2 ppm (ng-HCP/mg-IgG) |
| agarose | 63.7 ppm (ng-HCP/mg-IgG) | |
| Protein-A ligand leakage | MabSpeed™ rP111 | 3.4 ppm (ng-PrA/mg-IgG) |
| Recovery | >98% (UV280nm) | |
Applicable to a wide range of pH
Relatively high pH, such as pH of 3.5 is applicable on MabSpeed™ series. As Figure 6 shows, sharp elution can be achieved even at pH of 3.5, which allows one to have more options for purification conditions.
Figure 6. Effect of elution pH. Each data was taken with a spin column 0.5 mL media single cycle of 1-6 below: 1) equilibration buffer A, 6 BV, 2) sample load 1mg/mL g-globulin, 2 BV, 3) washout buffer A, 6 BV, 4) elution buffer B, 4 BV, 5) regeneration buffer C, 4 BV. Each of above step was 500 g x 1 min. Buffer A was PBS pH 7.4, buffer B was 0.1M sodium citrate pH 3.0, 3.5, and buffer C was 1M Tris-HCl pH 9.0.
High DBC and low Protein-A leakage after CIP cycles
Cleaning-in-place is an essential step in the production of pure Mabs in industrial applications. Figure 7 shows DBC (10% breakthrough) of polyclonal human IgG and Protein-A leakages as a function of exposure to alkaline conditions. As shown, MabSpeed™ rP111, even with its conventional rProtein-A ligand, withholds nearly the same of the initial dynamic binding capacity.
Figure 7. Dynamic binding capacity and Protein-A leakage after CIP with 0.1N NaOH. Experiments were performed with a column of 5mm ID x 5cm, by binding with phosphate buffered saline (pH 7.4) and eluting with 0.1M sodium citrate at pH 3.0. The contact time was 15min.
Laboratory benchtop purifications
The purification of a monoclonal antibody from CHO cell culture supernatant can be carried out with MabSpeed™ rP111 with a concentration of 0.5mg/mL at 3 minutes residence time in a 15 cm bed height column. Consecutively, the processed fluid was purified with ChromSpeed™ S101 and ChromSpeed™ Q101, as a flow of Figure 8 shows, and the intermediate and final products were analyzed with regard to yield, dimers, aggregates, Protein A carry over, and Host Cell Proteins (HCP) as shown in the following Table 3.
Table 3. Representative data analyzed at each process described in Figure 7.
*Data measured by size exclusion HPLC method..
**HCP and Protein-A concentration were measured by typical ELIZA kit, available on market.
| Accumulated Yield (%) | Dimers & aggregates (%)* | Protein-A (ppm)** | HCP (ppm)** | |
|---|---|---|---|---|
| Starting Material | 100 | - | - | 35717 |
| rP111 | 98 | < 0.5% | 4.4 | 3.1 |
| S101 | 90 | < 0.5% | 2.6 | < 0.5 |
| Q101 | 88 | < 0.5% | 2.4 | < 0.5 |
**HCP and Protein-A concentration were measured by typical ELIZA kit, available on market.
Figure 8. Process flow diagram of purification of a monoclonal antibody from CHO cell culture supernatant.
Ordering information
| Product Name / Unit | Product Number | ||
|---|---|---|---|
| MabSpeed™ rP102 |
10000 500 100 25 |
mL |
5-102-03 5-102-02 5-102-01 5-102-00 |
| MabSpeed™ rP111 |
10000 500 100 25 |
mL |
5-104-03 5-104-02 5-104-01 5-104-00 |
Related Data Sheets:
MabSpeed™ rP202 : No. 03-07-C-0201
Bioseparation Screening Columns : No. 03-01-C-0101
Available Documents:
Packing procedure for MabSpeed™ rP102
Packing procedure for MabSpeed™ rP111
Use and care instructions for MabSpeed™ rP102
Use and care instructions for MabSpeed™ rP111
*Regulatory Support Files (RSF) are available upon request.
경기도 수원시 장안구 장안로496번길 93(이목동) 2층 (주)충인과학 대표전화 : 031.241.6413 FAX : 031.241.6424
COPYRIGHT 2015 CHOONGIN ALL RIGHTS RESERVED.
COPYRIGHT 2015 CHOONGIN ALL RIGHTS RESERVED.